Showing posts with label openstreetmap. Show all posts
Showing posts with label openstreetmap. Show all posts
Friday, November 14, 2014

Tuesday, November 11, 2014
Missing Maps, Ebola and Learn OSM
I've spent a large amount of time over the past weeks mapping for Ebola. You can see some of my work, along with many others in Freetown, Kayes and more.
Often it has been an article of faith that the requesting organisations find mapping contributions useful; with feedback few and far between. For example, we saw some usage during Typhoon Haiyan, but it's hard to know if you are being truely effective.
This past fortnight, that doubt has been firmly put to bed. MSF has launched Missing Maps, proactively calling on the global community not to donate money, but to donate time.
Additionally, a thread on the HOTOSM mailing list has nicely overlapped in demonstrating value - and of course, personal anecdotes go a long way to making things relatable.
Given this renewed push from the people consuming open street map data in crisis situations, I began to wonder how I could turn my efforts from "dedicated mapper" to something more magnified.
I was lucky to have Nick Tailguy commit to a refreshed OSM Tasking manager guide and talk to the mailing lists - I've since contributed a number of small edits that will hopefully go on to encourage new mappers to confidently contribute in times of need.
To really kick it up a notch, I'm considering outreach to universities in ebola impacted locations - but I could really use the help of a dedicated few to push me further here; if the idea truely has value.
Often it has been an article of faith that the requesting organisations find mapping contributions useful; with feedback few and far between. For example, we saw some usage during Typhoon Haiyan, but it's hard to know if you are being truely effective.
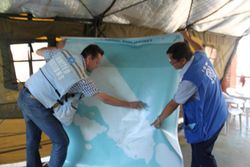
This past fortnight, that doubt has been firmly put to bed. MSF has launched Missing Maps, proactively calling on the global community not to donate money, but to donate time.
Additionally, a thread on the HOTOSM mailing list has nicely overlapped in demonstrating value - and of course, personal anecdotes go a long way to making things relatable.
Given this renewed push from the people consuming open street map data in crisis situations, I began to wonder how I could turn my efforts from "dedicated mapper" to something more magnified.
I was lucky to have Nick Tailguy commit to a refreshed OSM Tasking manager guide and talk to the mailing lists - I've since contributed a number of small edits that will hopefully go on to encourage new mappers to confidently contribute in times of need.
To really kick it up a notch, I'm considering outreach to universities in ebola impacted locations - but I could really use the help of a dedicated few to push me further here; if the idea truely has value.
Sunday, June 01, 2014
Mapillary: Open Source Streetview
http://www.mapillary.com/ is pretty neat. I remember describing something pretty like street view to a friend several years ago, but not much has really happened with the idea of people's ownership of data.
This edges us a little bit closer, but it'd be really good to see something truly open - platform and all.
I could certainly find a use for this in a lot of real estate, survey or similar applications.
This edges us a little bit closer, but it'd be really good to see something truly open - platform and all.
I could certainly find a use for this in a lot of real estate, survey or similar applications.
Friday, May 23, 2014
Strava + OpenStreetMap
Strava's 'slide' plugin and GPS heatmap is pretty neat. I've been using it to find roads or walking paths in forest areas with good success.
If you aren't sure what I'm talking about, there's a really neat talk about detecting paths based on averaged GPS traces, which no doubt could generally apply to a lot of drawing or tracing that humans have to undertake.
If you aren't sure what I'm talking about, there's a really neat talk about detecting paths based on averaged GPS traces, which no doubt could generally apply to a lot of drawing or tracing that humans have to undertake.
Wednesday, May 21, 2014
OpenStreetMap and Keepright: Fixing all of the redaction errors in Melbourne
The OSM license change that lead to redaction (here's a decent animation of the automated reverts) happened well over two years ago now; and a lot of remapping has taken place.
Unfortunately, humans aren't as good as some of the QA tools we have available, and that means a lot of valuable mapping is left untagged.
Keepright has been helping me find all of the untagged ways in Adelaide and Melbourne; both cities are now effectively 'clean'. Anything where the last edit was the redaction bot usually only needs a few tags or to be deleted if it's a duplicate.
I'd encourage any other mappers who feel their area is 'complete' to view it through a tool like Keepright - even if you pick as few as 5-10 errors to fix, you can make a big impact.
Unfortunately, humans aren't as good as some of the QA tools we have available, and that means a lot of valuable mapping is left untagged.
Keepright has been helping me find all of the untagged ways in Adelaide and Melbourne; both cities are now effectively 'clean'. Anything where the last edit was the redaction bot usually only needs a few tags or to be deleted if it's a duplicate.
I'd encourage any other mappers who feel their area is 'complete' to view it through a tool like Keepright - even if you pick as few as 5-10 errors to fix, you can make a big impact.
Sunday, December 22, 2013
Weekend mapping experiments, misc small but fulfilling development
This week I was working from home quite a lot, and given the holiday period, managed to get into the zone a fair bit.
It seems like this has continued into the open source work I'm doing. Most of the actual work is small at the end of the day, but has a larger impact.
So far; I've:
It seems like this has continued into the open source work I'm doing. Most of the actual work is small at the end of the day, but has a larger impact.
So far; I've:
- Rewritten a few parsers for planning alerts, now that scraperwiki isn't working.
- Pondered sending in a pull request or two so that we can add Google Enhanced Search Results to OSM nodes via Schema.org/linkeddata.
- Effectively finished(!) an import of suburb boundaries in SA, so that the Adelaide Metro journey planner is more useful.
- Started a writeup of importing Geelong buildings, which are interestingly all mapped by the council with a LIDAR equipped plane.
- Done a proof of concept "detect a planning alert and trigger a note on OSM" script, which will evolve.
- Discover vespucci actually supports bing background imagery, allowing a bunch more approximate building traces to take place.
- Had most of the mapping between Gawler and Tanunda start to render (map below)
- Ordered some Sugru, to make custom fit headphones.
View Larger Map
Monday, November 11, 2013
Haiyan, part 2
Interestingly, the majority of Tacloban is now mapped, as well as many other areas.
Someone's run stats: 245 volunteers who created nearly 440,000 map changes within the aforementioned extent. It's now up to 600,000+
More exciting than that, however, is the sheer number of emergency responders using OpenStreetMap data.
For example; since we mapped just about every building in Tacloban, satellites have been redirected to capture updated images.
The two are being explicitly combined. You can see a really detailed map of what survived, and what did not:
http://emergency.copernicus.eu/mapping/ems-product-component/EMSR058_02TACLOBANCITY_GRADING_DETAIL03/1
You can also see a mashup of geotagged photos from reports on the ground, backed up by OSM tiles:
https://haiyan.crowdmap.com/
While we can't change the fact thousands have died, there's a quite reasonable hope that accurate, up to date geospatial information can change the situation; enabling people to prioritise with data driving decisions in both the immediate and longer term recovery efforts.
Someone's run stats: 245 volunteers who created nearly 440,000 map changes within the aforementioned extent. It's now up to 600,000+
More exciting than that, however, is the sheer number of emergency responders using OpenStreetMap data.
For example; since we mapped just about every building in Tacloban, satellites have been redirected to capture updated images.
The two are being explicitly combined. You can see a really detailed map of what survived, and what did not:
http://emergency.copernicus.eu/mapping/ems-product-component/EMSR058_02TACLOBANCITY_GRADING_DETAIL03/1
You can also see a mashup of geotagged photos from reports on the ground, backed up by OSM tiles:
https://haiyan.crowdmap.com/
While we can't change the fact thousands have died, there's a quite reasonable hope that accurate, up to date geospatial information can change the situation; enabling people to prioritise with data driving decisions in both the immediate and longer term recovery efforts.
Sunday, November 10, 2013
Haiyan, mapping and disaster relief
Things don't look so great for large parts of the Philippines right now:
You can see a few images in articles or read about people looking for family on reddit.
If you are experienced enough to contribute to openstreetmap, there's an effort to map every building in Tacloban taking place.
I've put in a few hours here, and it's likely more tasks will spring up as international organisations start expressing their needs - be it mapping of rivers, infrastructure or more.
One of the things which has struck me during recent travels to India is how similar other countries can be to our own experiences.
India, for example is well established in outsourcing IT and other related disciplines. The people who work here are broadly westernised: fashion, consumables and more are practically identical.
The main fear that tends to be expressed in tech forums like Slashdot is a 'wave of poor quality work taking food out of the mouths of hungry western developers'. While there may be some truth to this; the other, unexpressed truth is often the diffusion of wealth, knowledge and skills to a class of people who are just like us.
Often you hear that "the richest 1% have 46% of the wealth", but it's rare to think of yourself as part of the next richest; as a measurement per head of population.
Interestingly about India, many of the lower/middle skilled workers seem to come from various regional areas, trying to make it big in Dehli. The choice between uncertain but reasonable income and life in rural areas is obviously a tough one, but one many people make.
This means that the people you rely on while travelling are impacted by disasters in remote areas. I'd wager what holds for people in the service industry in Dehli is likely as just valid for administration workers in the Manila based outsourcing industry; another heavily relied upon centre of skills.
While sometimes people can be reluctant to donate money (corruption is anecdotally a problem in many areas); I feel quite good that I'm able to donate time to produce a high quality data asset; and that asset may very well be used to save or improve upon the quality of lives.
Earlier, the world's strongest storm battered the central Philippines across a 600-kilometre front, killing at least 100 people and forcing millions of people to flee to safer ground.
Captain Andrews of the Philippines Civil Aviation Authority says at least 100 people are dead in Tacloban in the eastern Philippines, one of the first areas to be hit.
If you are experienced enough to contribute to openstreetmap, there's an effort to map every building in Tacloban taking place.
I've put in a few hours here, and it's likely more tasks will spring up as international organisations start expressing their needs - be it mapping of rivers, infrastructure or more.
One of the things which has struck me during recent travels to India is how similar other countries can be to our own experiences.
India, for example is well established in outsourcing IT and other related disciplines. The people who work here are broadly westernised: fashion, consumables and more are practically identical.
The main fear that tends to be expressed in tech forums like Slashdot is a 'wave of poor quality work taking food out of the mouths of hungry western developers'. While there may be some truth to this; the other, unexpressed truth is often the diffusion of wealth, knowledge and skills to a class of people who are just like us.
Often you hear that "the richest 1% have 46% of the wealth", but it's rare to think of yourself as part of the next richest; as a measurement per head of population.
Interestingly about India, many of the lower/middle skilled workers seem to come from various regional areas, trying to make it big in Dehli. The choice between uncertain but reasonable income and life in rural areas is obviously a tough one, but one many people make.
This means that the people you rely on while travelling are impacted by disasters in remote areas. I'd wager what holds for people in the service industry in Dehli is likely as just valid for administration workers in the Manila based outsourcing industry; another heavily relied upon centre of skills.
While sometimes people can be reluctant to donate money (corruption is anecdotally a problem in many areas); I feel quite good that I'm able to donate time to produce a high quality data asset; and that asset may very well be used to save or improve upon the quality of lives.
Monday, September 30, 2013
Dog of a week... and it's only monday?
Feeling a bit overwhelmed already
- I don't know why I have to argue about DI, but I find I do. This neatly gets away from fat controllers, fat models and finally the the stuff that matters.
- I pulled together a quick ABN input on the weekend. I figured I've built the thing enough times to do it right, and other Australian web devs might have the same underlying issue.
- Many, many pull requests this week, contributing to Fat Free CRM, Chef recipes and even my much unloved fork of tipsy.
- All of Adelaide, most of Melbourne, Tasmania, Brisbane and Sydney have had a lot of attention from keepright.ipax.at - Adelaide has the cleanest map data of the lot, but Melbourne isn't far behind.
My main focus: unclosed ways, redaction errors, sport tags without a physical associated tag - mostly things that won't show up in the rendering. - Took the opportunity to work from home today, so spent my lunch break constructing gravel path.
Sunday, June 23, 2013
OpenStreetMap - Adelaide status
I've made a reasonable amount of progress in mapping buildings around Adelaide. I started out in Rosewater, and have pushed along to Croydon.
 |
| Croydon |
 |
| West Croydon |
 |
| Woodvillie Park |
 |
| St Clair Housing Development Interestingly has attracted a few mappers to complete roads in the area. |
 |
| Woodville North Unfortunately, bing imagery is out of date as many of the Housing Trust homes are getting knocked down. Needs ground survey or new images to be completed. |
 |
| Wingfield Many industrial buildings mapped, but not to complete detail |
 |
| Railyards |
 |
| Port Adelaide, building map status is effectively complete. Needs street numbering or businesses to be tagged next. |
 |
| West Lakes, a small patch of mapping. There are a few other mappers in the area, so hopefully this attracts their interest a bit. |
 |
| Outer Harbour, a small patch of mapping |
 |
| Glenside Area, a small patch of housing |
 |
| McLaren Vale YetiHunter is an XPlane user, and together we mapped a lot of vineyards in the area, for more realistic terrain. |
 |
| Vineyards in the Hills YetiHuntery did the majority of this area, but the satellite imagery may be out of date since the Cherryville fire. |
So, why am I still at this?
I'm quite encouraged by OpenTripPlanner, as well as the already mentioned ability to use scenery in XPlane.
Going a bit further, I've had a bit of an interest in Wine and Vineyard metadata for some time. Previously, the best open data set I knew of was Freebase - here's a list of their vineyards. We tend to know which vintages of wine from what producer are good when we acquire a few favourites, but the rest is still a lot of marketing.
Why can't we trace the origins of a local wine right to the specific vineyard it came from?
Hypothetically, take your favourite bottle, and pull out your android phone. Scan the barcode, get shown on a map where it likely came from.
To find similar soil conditions, move slightly down the road - using your smart phone to help you discover less well known producers.
I've also done a little bit of work on working out what's on fire. To date, I haven't had this running as a service anywhere, but I suspect it'll be a job for my Pi.
I'm quite interested in the idea of knowing when a house or industrial area may have caught on fire - this seems like a quite valuable data set to insurance and others in the property industry.
Finally, it's kind of nice to be able to work out which houses have swimming pools or tennis courts - the key difference between an open data set like this and something based on sales or transactions is the completeness of the data - you can say with more certainty you know which houses in the area have these features.

Monday, May 13, 2013
Consuming GeoRSS and querying OpenStreetMap
In Adelaide, there was an unexpected fire. It was a bushfire, and I'd just been mapping the area earlier that day - ironically, tracing some of the forests which were being burnt out at that very point in time.
I decided to go and see what was available for fire alerts around the nation.
It turns out the majority of fire authorities publish GeoRSS. I took the feeds and aggregated them, plus put in a transformation of the data to JSON.
Using Leaflet, I added a rendering of particular fires.
Using the OpenStreetMap Overpass API, I queried for "all areas in a 500m bounding box", and again using Leaflet, rendered those polygons onto a map.
Here's the Project:
https://github.com/CloCkWeRX/burning-down
Here's a few screenshots:
 Coverage, for most of Australia. WA doesn't provide openly licensed data, and South Australia's does not contain lat/long info.
The few you see in those states are from Sentinel, a satellite based system for detecting 'hot spots' that may indicate a fire.


I decided to go and see what was available for fire alerts around the nation.
It turns out the majority of fire authorities publish GeoRSS. I took the feeds and aggregated them, plus put in a transformation of the data to JSON.
Using Leaflet, I added a rendering of particular fires.
Using the OpenStreetMap Overpass API, I queried for "all areas in a 500m bounding box", and again using Leaflet, rendered those polygons onto a map.
Here's the Project:
https://github.com/CloCkWeRX/burning-down
Here's a few screenshots:

The few you see in those states are from Sentinel, a satellite based system for detecting 'hot spots' that may indicate a fire.

Here, a number of resident buildings are marked as 'at risk' from a fire. In reality, these are probably safe, due to fires in these areas tending to be contained to residential areas.
On the other hand, you can certainly consider adding an Open Street Bug report if someone's house may have burned down!

This is more interesting - there's a fire or other emergency right next to a national park. National parks are made from trees, which in my experience tend to catch on a whole lot of fire!
Obviously this sort of incident is well in hand if the fire authorities are aware of it, but it is interesting to see that fuel sources are being picked up.
My next efforts here are going to be around encouraging edits near the area - if there isn't much detail on water sources (dams, swimming pools, rivers, lakes); it certainly makes sense to identify those if there's already been a fire once.
I also made a bit of effort to aggregate the feed output into sqlite - I might go run up a basic server and run this as a service at some later point, as aggregating this data seems useful.
The thing I like most about this - it's trivial to take any GeoRSS feed and query OpenStreetMap for nearby things - I've done fairly wide ranging queries with a narrow bounding box so far; but those are easy enough things to tweak.
Saturday, April 06, 2013
New OpenStreetMap Editor available.
http://ideditor.com/ is pretty neat - it's a bit slower than potlatch, but try tracing the roof of a house.
Here's the full blog post. It certainly looks like the kind of editor you want for any kind of property data capture - imagine doing a kerbside valuation and pulling this up on an ipad to explore / add data.
Here's the full blog post. It certainly looks like the kind of editor you want for any kind of property data capture - imagine doing a kerbside valuation and pulling this up on an ipad to explore / add data.
Wednesday, October 31, 2012
Note to self: get the Planning Alerts API and OSM, and mix them together
Licencing is probably not a good match between planning alerts and OSM; but I should probably render planning applications as a feed on open street map.
http://www.planningalerts.org.au/api/howto points to this example, but it shouldn't be too hard to apply to an OpenStreetMap slippy map.

The more interesting thing will be
http://www.planningalerts.org.au/api/howto points to this example, but it shouldn't be too hard to apply to an OpenStreetMap slippy map.

The more interesting thing will be
- Flagging buildings as under construction automagically in OpenStreetMap, or adding a bug report
- API that mashes up the two data sets
Tuesday, October 30, 2012
Openstreetmap, rosewater
I wonder if I can outline every building in rosewater by the end of the week.
You can see my progress on openstreetmap.org - houses, trees, even power lines are added.

You can see my progress on openstreetmap.org - houses, trees, even power lines are added.

Subscribe to:
Posts (Atom)